Alright friends welcome back, lets plot some sound on the matplotlib.
# Quickly import essential libraries
import queue
import sys
from matplotlib.animation import FuncAnimation
import matplotlib.pyplot as plt
import numpy as np
import sounddevice as sd
## Lets define audio variables
## We will use the default PC or Laptop mic to input the sound
device = 0 # id of the audio device by default
window = 1000 # window for the data
downsample = 1 # how much samples to drop
channels = [1] # a list of audio channels
interval = 30 # this is update interval in miliseconds for plot
## lets make a queue
q = queue.Queue()
## Please note that this sd.query_devices has an s in the end.
device_info = sd.query_devices(device, 'input')
samplerate = device_info['default_samplerate']
length = int(window*samplerate/(1000*downsample))
## lets print it
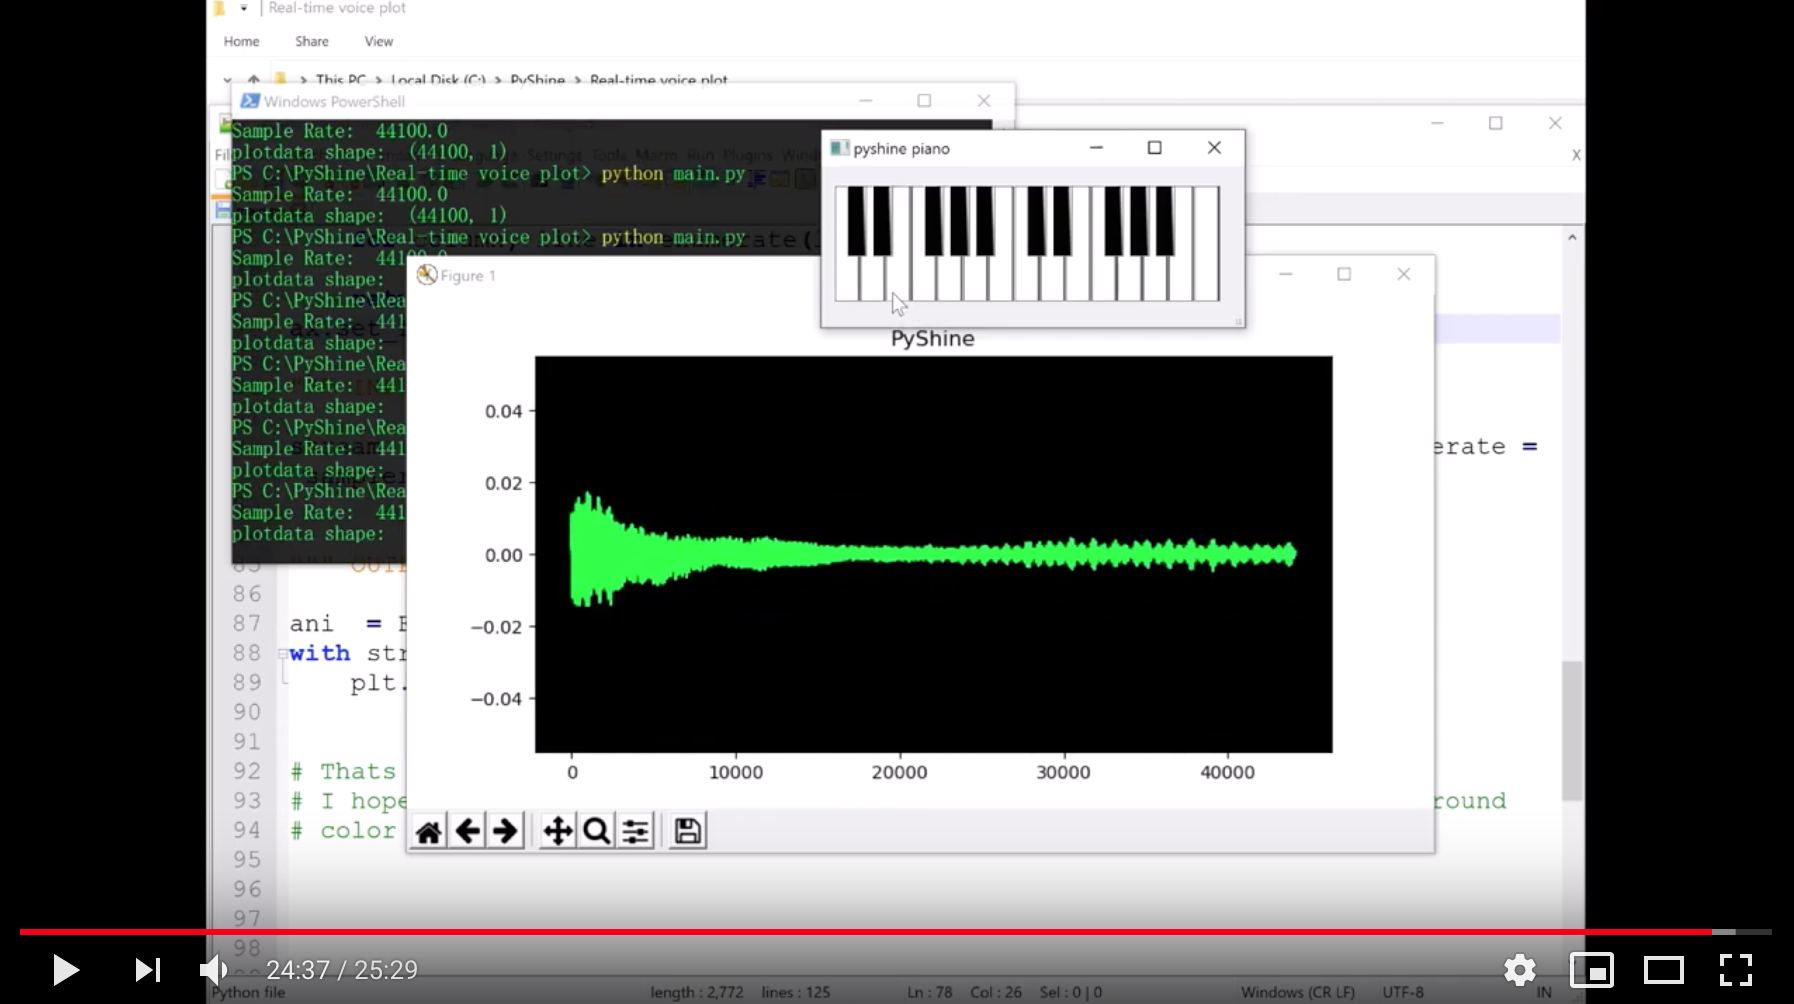
print("Sample Rate: ", samplerate)
## Typical sample rate is 44100 so lets see.
## Ok so lets move forward
## Now we require a variable to hold the samples
plotdata = np.zeros((length,len(channels)))
## Lets look at the shape of this plotdata
print("plotdata shape: ", plotdata.shape)
## So its vector of length 44100
## Or we can also say that its a matrix of rows 44100 and cols 1
## next is to make fig and axis of matplotlib plt
fig,ax = plt.subplots(figsize=(8,4))
## lets set the title
ax.set_title("PyShine")
## Make a matplotlib.lines.Line2D plot item of color green
## R,G,B = 0,1,0.29
lines = ax.plot(plotdata,color = (0,1,0.29))
## We will use an audio call back function to put the data in queue
def audio_callback(indata,frames,time,status):
q.put(indata[::downsample,[0]])
## now we will use an another function
## It will take frame of audio samples from the queue and update
## to the lines
def update_plot(frame):
global plotdata
while True:
try:
data = q.get_nowait()
except queue.Empty:
break
shift = len(data)
plotdata = np.roll(plotdata, -shift,axis = 0)
## # Elements that roll beyond the last position are
## # re-introduced
plotdata[-shift:,:] = data
for column, line in enumerate(lines):
line.set_ydata(plotdata[:,column])
return lines
ax.set_facecolor((0,0,0))
## Lets add the grid
ax.set_yticks([0])
ax.yaxis.grid(True)
""" INPUT FROM MIC """
stream = sd.InputStream( device = device, channels = max(channels), samplerate = samplerate, callback = audio_callback)
""" OUTPUT """
ani = FuncAnimation(fig,update_plot, interval=interval,blit=True)
with stream:
plt.show()
## Thats it lets check. Let me play some sound.
## I hope you like the audio please comment. And we can also add some background
## color to the plot. Simply we set the face color of ax.

Enjoyed this post? Never miss out on future posts by following us
