Every developer knows the feeling of landing in a new repository: fifty folders, a README that explains how to run the thing but not how it is built, and an hour of grepping before the shape of the system becomes visible. GitDiagram collapses that hour into seconds. Paste any public GitHub URL - or just replace hub with diagram in the address bar - and you get an interactive, system-level architecture diagram where every node links to the actual file or folder it represents. The project has climbed past 16,000 stars on GitHub, is MIT licensed, and its live site at gitdiagram.com works on public repositories without an account.
Understanding the Architecture
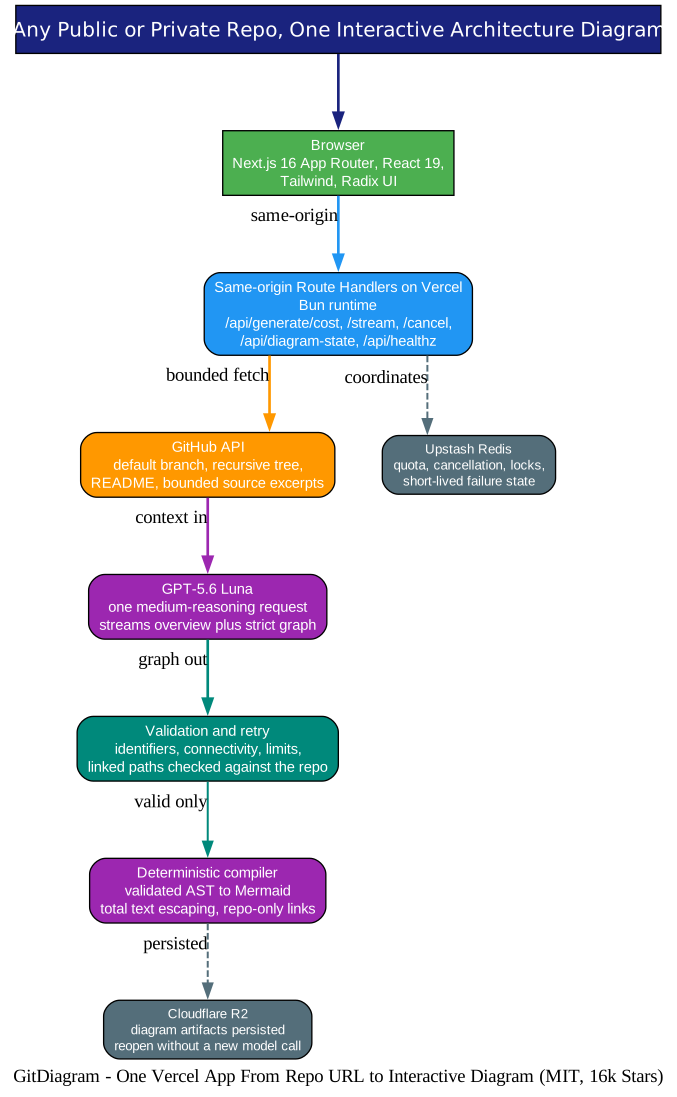
The architecture diagram above shows the whole journey, and the first thing to notice is how few boxes there are. There is no separate AI microservice, no Postgres, no FastAPI sidecar. One Next.js application on Vercel serves both the interface and the generation endpoints, with two external services for state. Let’s walk through the pieces.
One app, same-origin API. The frontend is Next.js 16 App Router with React 19, TypeScript, Tailwind, and Radix UI. The generation endpoints are Next.js Route Handlers running on Vercel’s Bun runtime: /api/generate/cost estimates a run after bounded GitHub ingestion, /api/generate/stream streams Server-Sent Events while the graph is being planned, /api/generate/cancel records authenticated cancellation, and /api/diagram-state reads and writes the persisted result. Because the API is same-origin, the browser credentials, rate limits, and cancellation signals all stay coherent.
Bounded ingestion. GitDiagram fetches the repository’s default branch, recursive tree, and README through the GitHub API, then adds integrity-checked source excerpts - deliberately bounded, favoring substantive runtime modules and spreading samples across long files. Truncated trees and oversized inputs are rejected before any model work begins. That discipline is why a diagram run stays fast and cheap instead of ballooning with repository size.
One model call. The managed pipeline spends a single GPT-5.6 Luna request at medium reasoning: it streams a short architecture overview, then emits a strict graph of groups, nodes, edges, shapes, labels, and repository paths. Additional model calls are reserved for structural repairs or a single recovery when a request runs slow - the slow connection is cancelled before its replacement starts.
Two storage services. Cloudflare R2 keeps the diagram artifacts so later visits reopen instantly without another model call, and Upstash Redis handles quota accounting, cancellation tokens, distributed locks, and short-lived failure state. That is the entire state footprint.
How Generation Works
Understanding the Pipeline
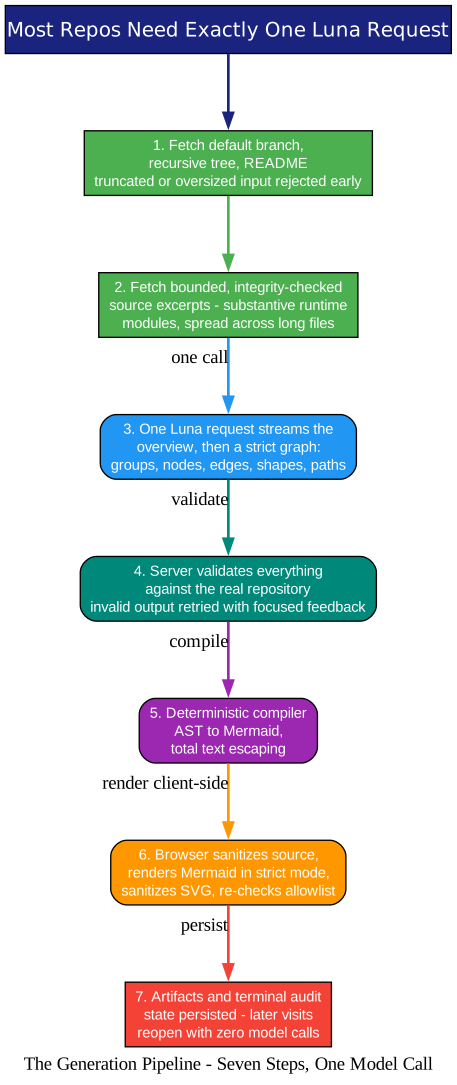
The pipeline diagram above expands the seven steps, and the pattern worth stealing for your own AI features is visible in steps four through six: validate, compile, sanitize - in that order, twice.
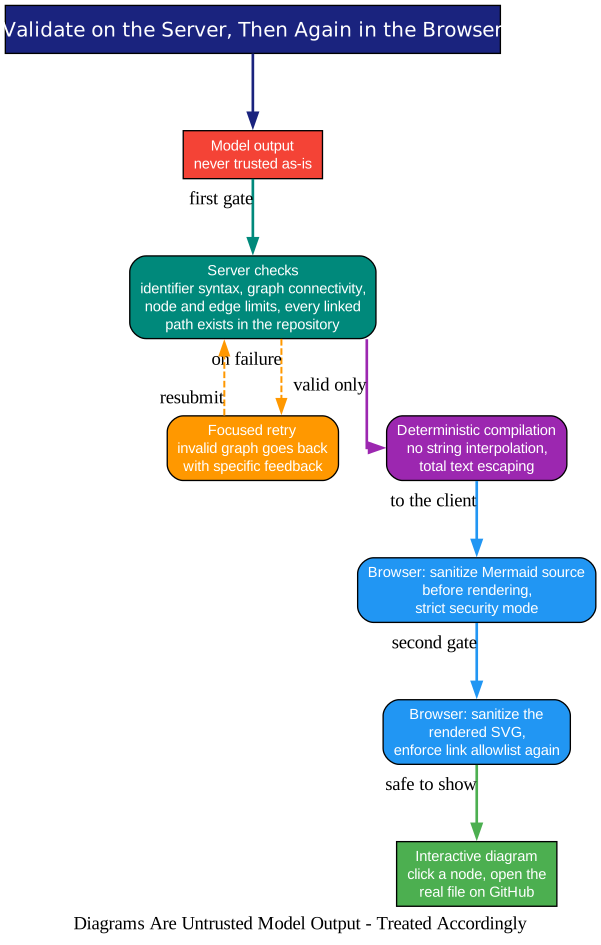
Steps one and two build a bounded picture of the repository. Step three is the single Luna request. Step four is where GitDiagram diverges from the usual “trust the model output” demo code: the server validates identifier syntax, graph connectivity, node and edge limits, and - this is the clever part - every linked path against the actual repository tree. A model cannot invent a plausible-looking file path and get away with it; invalid output goes back for a retry with focused feedback on exactly what was wrong.
Step five compiles the validated structure into Mermaid deterministically. There is no string interpolation from model text into the output; the compiler is code, and its full parser remains in the test suite as a contract test. Step six happens in your browser: sanitize the Mermaid source, render it in strict security mode, sanitize the resulting SVG, and enforce the link allowlist one more time. Step seven persists the artifact and terminal audit state.
Diagrams are untrusted model output. GitDiagram treats them accordingly, and the safety diagram below shows the two gates - server-side validation and client-side sanitization - that stand between the model and your browser.
This is the same discipline we admired in Cloudflare’s security-audit skill, where findings must survive schema validation and independent verification before they reach a report. Structured output from a language model is a draft, not a product. The projects that feel trustworthy are the ones where you can point at the exact code that rejects bad output.
The State Model
Understanding Where Things Live
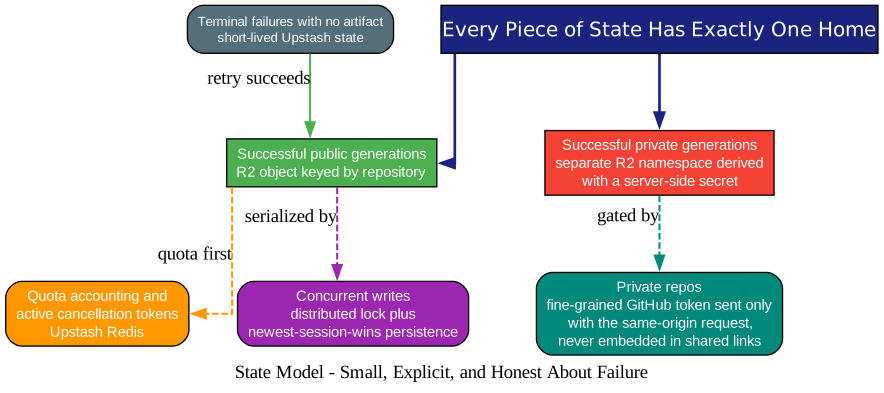
The state diagram above maps every piece of state to exactly one home, which is a surprisingly rare property in web apps.
Public generations live in R2, keyed by repository, so the second visitor gets the same diagram instantly. Private generations live in a separate R2 namespace whose key is derived with a server-side secret - the private and public artifact stores never touch. Private repo support works by having you paste a fine-grained GitHub personal access token in the browser; it is sent only with the relevant same-origin request and is never embedded in links you can share. Quota, cancellation, and locks live in Redis, including the distributed lock with newest-session-wins persistence for concurrent writes, and terminal failures without a saved artifact get short-lived state so the system does not accumulate a graveyard of stale entries.
The long-running side is handled with equal care: a 300-second Vercel function budget with a shorter application deadline, explicit upstream timeouts, retries, structured logs, heartbeats, and distributed cancellation rather than process-local state. Quota reconciliation and persistence always have time to finish.
Try It Yourself
For public repositories there is nothing to install - open gitdiagram.com, paste a GitHub URL, or apply the URL trick: change github.com to gitdiagram.com (or github to diagram inside the URL) and land directly on the diagram. Export options include copying the Mermaid source or downloading a PNG, which makes it easy to drop the result into documentation.
Self-hosting is a Bun one-liner sequence:
git clone https://github.com/ahmedkhaleel2004/gitdiagram.git
cd gitdiagram
bun install
cp .env.example .env
bun run dev
At minimum you configure R2, Upstash, and one AI provider (OpenAI by default, OpenRouter supported) in .env. A GitHub token is optional but recommended for higher API limits. The deployment failover guide documents a minimal standalone Docker build kept as a cold-recovery recipe, and the dev setup guide covers prerequisites. Before any pull request, the project expects lint, typecheck, test, and build to pass locally.
Why This One Matters
Repository comprehension is about to become an AI-native task, and GitDiagram is a quietly excellent template for how to build it responsibly: bounded context instead of everything-you-can-stuff, one model call instead of a chain, deterministic compilation instead of string munging, validation against ground truth instead of vibes, and persistence so nobody pays twice for the same answer. It is inspired by Gitingest, which turns repositories into text for LLM contexts - GitDiagram applies the same restraint to the visual side. Between the URL trick, the Mermaid export, and the clickable source links, it has already earned a permanent slot in the toolbox; the architecture discipline on display is the bonus lesson. If you enjoy tools that treat model output as untrusted input, also see how BrowserSkill gates agent browser access with explicit tab borrowing - the same philosophy applied to a different surface.
Related Posts
- Cloudflare’s Security Audit Skill: Turn Your Coding Agent Into a Security Auditor
- BrowserSkill: Let Your Coding Agent Use Your Logged-In Browser Without Taking It Over

Enjoyed this post? Never miss out on future posts by following us


