Learn Loki in a Single Post: Complete Tutorial From Labels and LogQL to Promtail, Grafana, and Production
Loki is the logs pillar of the Grafana observability stack — a horizontally-scalable log aggregation system that indexes only labels (not the full text), making it dramatically cheaper and faster to ingest than Elasticsearch/ELK. It pairs with Prometheus (metrics) and OpenTelemetry (traces) to complete the observability triad. This single post covers the whole system in five stages, with hand-drawn diagrams and runnable config.
Learning Roadmap
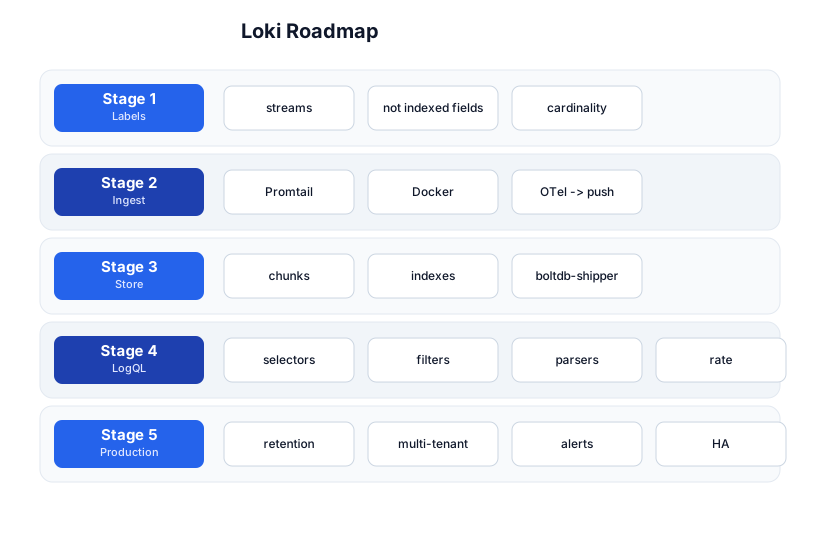
The roadmap moves from the label model (Stage 1), through ingest (Stage 2), storage (Stage 3), LogQL (Stage 4), and production (Stage 5). The Prometheus tutorial is the prerequisite — Loki shares the same label-cardinality model.
Stage 1 — Labels: Streams, Not Indexed Fields
The key insight: index labels, not log content
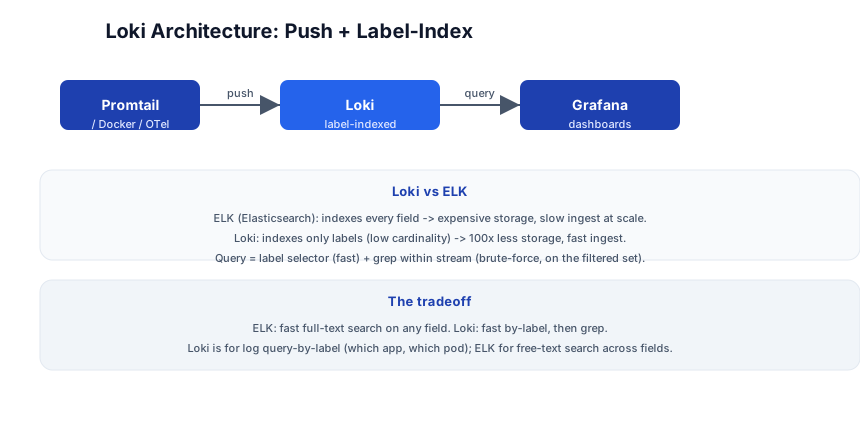
Loki’s fundamental difference from Elasticsearch/ELK: it indexes only the labels (metadata about the log line — which app, which environment, which pod), not the log line content itself. The log text is stored compressed in chunks; at query time, Loki first finds the right streams by label (fast, index lookup), then greps within those streams (brute-force, but on a small filtered set).
Loki vs ELK — the tradeoff
| ELK (Elasticsearch) | Loki | |
|---|---|---|
| What’s indexed | every field in the log line | only labels |
| Storage | expensive (full inverted index) | 10-100x less (just labels + compressed chunks) |
| Ingest speed | slower (indexing every field) | fast (only label index) |
| Query: by label | fast | fast (index lookup) |
| Query: full-text search | fast (inverted index) | slower (grep within stream) |
| Best for | free-text search across many fields | log query-by-label (which app, which pod) |
The rule: if you primarily query logs by which application/pod/environment produced them (label-based), Loki is cheaper and faster. If you need to search across any field in the log content (full-text), ELK is better. Most operational logging is label-based (“show me the logs for the payment service in production”), which is why Loki has become the default.
Labels and cardinality
# A log stream = a unique set of label values
{app="payment-api", env="prod", instance="pod-abc123"}
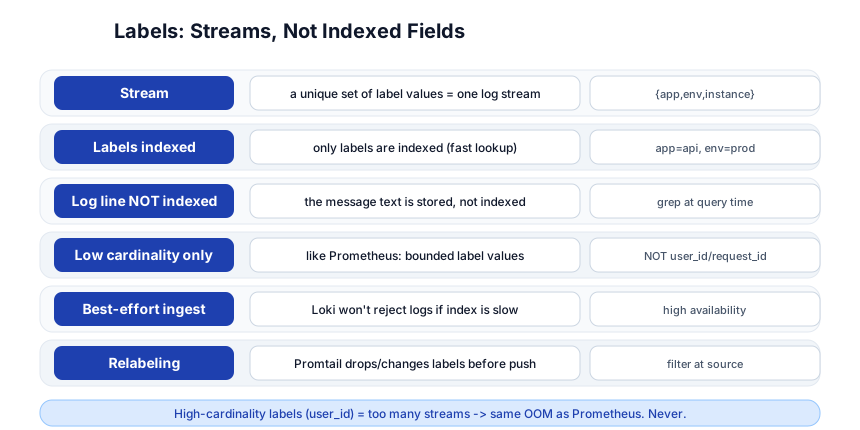
- A stream is a unique combination of label values. All log lines with the same labels go into one stream.
- Low cardinality only — same rule as Prometheus:
app,env,namespace,clusterare good labels (dozens of values).user_id,request_id,trace_idare bad labels (millions of values → millions of streams → OOM). - Relabeling — Promtail can drop, add, or change labels before pushing to Loki (filter at source).
Pitfall: High-cardinality labels (
user_id,request_id) create millions of streams — same OOM as Prometheus. If you need per-request log search, use the trace ID as a field inside the log line (parsed at query time with LogQL), not as a label. Labels are for grouping (which app), not for identifying (which request).
Stage 2 — Ingest: Promtail, Docker, OpenTelemetry
Promtail — the log shipper
Promtail is Loki’s log shipper (the log equivalent of Prometheus’s scrape). It runs on each host, reads log files, adds labels, and pushes to Loki:
# promtail-config.yml
server:
  port: 9080

positions:
  filename: /tmp/positions.yaml

clients:
  - url: http://loki:3100/loki/api/v1/push

scrape_configs:
  - job_name: app-logs
    static_configs:
      - targets: [localhost]
        labels:
          job: payment-api
          env: prod
          __path__: /var/log/app/*.log
Promtail tails the log files (__path__), attaches labels (job, env), tracks its position (so it resumes on restart), and pushes to Loki’s /loki/api/v1/push endpoint.
Docker logging driver
// Docker Compose: ship container logs directly to Loki
{
  "logging": {
    "driver": "loki",
    "options": {
      "loki-url": "http://loki:3100/loki/api/v1/push",
      "loki-pipeline-stages": "[{\"labels\":{\"app\":\"payment-api\"}}]"
    }
  }
}
Docker can push container logs directly to Loki without Promtail — the loki logging driver handles it.
OpenTelemetry
Loki can ingest via the OpenTelemetry Collector — the OTel collector’s Loki exporter sends logs with OTel attributes mapped to Loki labels. This is the unified path: OTel for traces + metrics + logs, with Loki as the log backend.
Other ingest paths
- Fluentd / Fluent Bit — popular alternatives to Promtail with a Loki output plugin.
- Vector — another log shipper with Loki support.
- Direct API push — any application can POST logs to
/loki/api/v1/push(for custom integrations).
Stage 3 — Storage: Chunks, Index, boltdb-shipper
How Loki stores logs
- Chunks — log lines are compressed (gzip/snappy) into chunks (~1.5MB each). A chunk belongs to one stream and a time range. Chunks are stored in object storage (S3, GCS, filesystem).
- Index — maps
label set + time range → chunk IDs. This is the only index; it’s small because it only covers labels.
boltdb-shipper — the modern index store
Older Loki used an index per day in BoltDB. boltdb-shipper (the default since Loki 2.0) stores index files in object storage alongside chunks, with a local BoltDB cache for fast lookups. This scales horizontally without a shared database.
Object storage backends
# loki-config.yml
storage_config:
  boltdb_shipper:
    active_index_directory: /loki/index
    cache_location: /loki/cache
    shared_store: filesystem   # or s3, gcs, azure
  filesystem:
    directory: /loki/chunks
Loki supports: filesystem (dev), S3, GCS, Azure Blob, BOS. For production, use S3/GCS — cheap, durable, infinitely scalable. Loki doesn’t need a database (unlike ELK’s Elasticsearch cluster); the index + chunks live in object storage.
Stage 4 — LogQL
Stream selectors + line filters + parsers
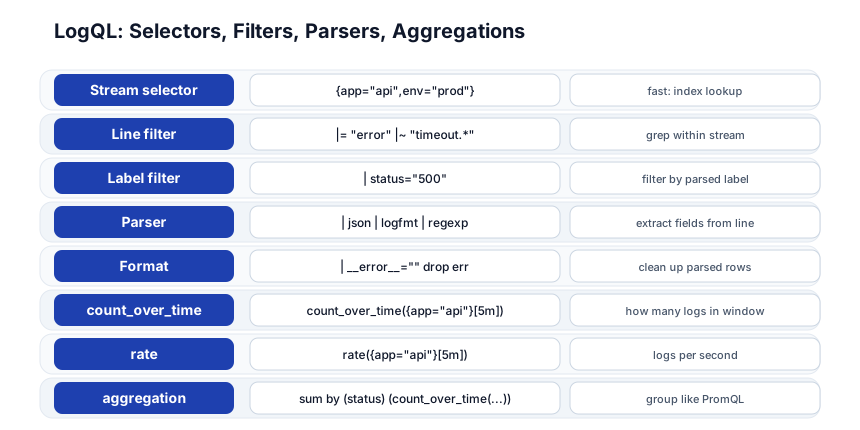
# 1. Stream selector (fast: index lookup)
{app="payment-api", env="prod"}

# 2. Line filter (grep within stream)
{app="payment-api"} |= "error"

# 3. Parser (extract fields from the log line)
{app="payment-api"} |= "error" | json

# 4. Label filter (on parsed fields)
{app="payment-api"} |= "error" | json | status >= "500"

# 5. Aggregation (like PromQL)
sum by (status) (count_over_time({app="payment-api"} |= "error" | json [5m]))
LogQL syntax
| Syntax | What it does |
|---|---|
{app="api"} | stream selector (label match) |
\|= "error" | line contains “error” |
\|~ "timeout.*" | line matches regex |
!= "debug" | line does NOT contain “debug” |
\| json | parse line as JSON → extract fields |
\| logfmt | parse logfmt (key=value) |
\| regexp | parse with a custom regex |
count_over_time({...}[5m]) | number of log lines in 5m window |
rate({...}[5m]) | logs per second |
sum by (status) (...) | aggregate (like PromQL) |
LogQL vs PromQL
LogQL is designed to feel like PromQL:
- Same label selector syntax:
{app="api", env="prod"}. - Same aggregation:
sum by (job) (rate(...[5m])). - Same range vector:
[5m]window. - Difference: LogQL adds line filters (
|=,|~,!=) and parsers (| json,| logfmt) that operate on the log content — PromQL doesn’t have these because metrics don’t have content.
Log-based alerts
# alerting_rules.yml
groups:
  - name: log-alerts
    rules:
      - alert: HighErrorLogs
        expr: sum by (app) (rate({app="payment-api"} |= "error" [5m])) > 10
        for: 10m
        labels:
          severity: page
        annotations:
          summary: "High error log rate on "
Loki’s ruler evaluates LogQL alert expressions (just like Prometheus’s alerting rules) and sends firing alerts to Alertmanager. This means you can alert on log patterns (“error rate in the payment service logs > 10/s for 10m”) without a separate monitoring system.
Pitfall: LogQL line filters (
|= "error") grep through the log lines — they’re slower than label selectors. Always use the label selector first ({app="api"}) to narrow to the right streams, then line-filter within that small set. Filtering all streams for “error” is a full scan of everything.
Stage 5 — Production
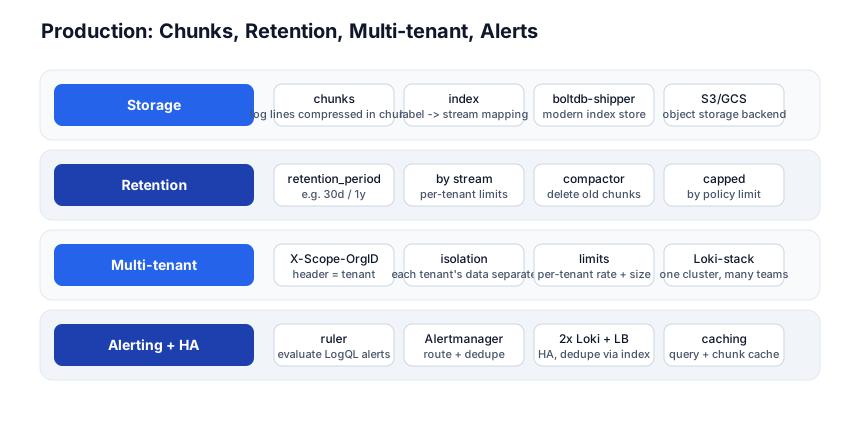
Retention
limits_config:
  retention_period: 30d        # global default
  retention_stream:
    - selector: '{namespace="audit"}'
      priority: high
      period: 730d              # 2 years for audit logs
Loki deletes old chunks via the compactor. Retention can be global (30d) or per-stream (audit logs kept 2 years). The compactor runs periodically and removes chunks past their retention.
Multi-tenancy
# Each request carries X-Scope-OrgID header = tenant ID
curl -H "X-Scope-OrgID: team-payments" http://loki:3100/loki/api/v1/query?query=...
Loki is multi-tenant by default — every request carries an X-Scope-OrgID header identifying the tenant. Each tenant’s logs, index entries, and chunks are isolated. Per-tenant rate limits and retention policies can be configured. This lets one Loki cluster serve many teams.
High availability
Run two Loki instances behind a load balancer. Since the index and chunks live in object storage (shared), both instances see the same data. Ingest is deduplicated (if both receive the same log, one copy is kept). Queries can go to either instance.
Caching
query_range:
  cache_results: true
  results_cache:
    cache:
      embedded_cache:
        enabled: true
        max_size_mb: 100
Loki can cache query results (repeated dashboard queries resolve instantly) and chunks (recently accessed chunks stay in memory/Redis). Caching is critical for Grafana dashboards that re-query the same time range on every refresh.
Grafana integration
Loki is designed for Grafana — add Loki as a data source, write LogQL in the Explore panel, and build log dashboards. The “Logs” panel in Grafana shows live log streams; the “LogQL” panel runs queries. Loki + Prometheus + Grafana = the complete Grafana observability stack (metrics + logs + dashboards + alerts).
Quick-Start Checklist
- Run Loki + Promtail + Grafana —
docker runthe Grafana Loki stack, or use the Helm chart. - Configure Promtail — tail your app logs, add labels (
job,env). - Open Grafana → add Loki as a data source → Explore.
- Query with LogQL —
{app="myapp"}to see all logs, add|= "error"to filter. - Parse JSON logs —
{app="myapp"} | jsonto extract fields. - Aggregate —
sum by (status) (count_over_time({app="myapp"} |= "error" [5m])). - Add labels at the source (Promtail/Docker) — not at query time.
- Keep cardinality low — never use
user_id/request_idas labels. - Configure retention — 30d default, longer for audit logs.
- Set up log-based alerts — Loki ruler + Alertmanager on LogQL expressions.
Common Pitfalls
- High-cardinality labels —
user_id/request_idas labels → millions of streams → OOM. Use them as fields in the log line, parsed at query time. - Full-text search across all streams —
|= "error"without a label selector greps everything. Always narrow with{app="..."}first. - No parser for structured logs — if your logs are JSON, use
| jsonto extract fields; raw text filtering misses structured data. - Promtail not tracking position —
positions.filenamemust be on a persistent volume; otherwise Promtail re-reads on restart. - No retention configured — logs accumulate forever; set
retention_period. - Single Loki instance in prod — no HA; run two behind a load balancer with shared object storage.
- No caching — Grafana dashboard queries re-run on every refresh; enable query result caching.
- Using ELK when Loki suffices — if you query by label (which app/pod/env), Loki is 10-100x cheaper. Only use ELK if you need true full-text search across many fields.
Further Reading
- Loki Docs — the official reference
- LogQL Docs — the query language
- Promtail Docs — the log shipper
- Grafana Loki GitHub — the source
- Loki vs ELK — the comparison
Related guides
Loki is the logs pillar of observability — these PyShine tutorials connect to it:
- Learn Prometheus in One Post — the metrics pillar; same label model, same Grafana dashboards, same Alertmanager.
- Learn Observability in One Post — the umbrella; metrics + logs + traces. Loki is the logs half.
- Learn Kubernetes in One Post — the Loki Helm chart runs on K8s; Promtail discovers pods.
- Learn Docker in One Post — the Docker logging driver ships to Loki; run the stack in Compose.
- Learn Elasticsearch in One Post — the comparison; ELK for full-text search, Loki for label-based log aggregation.
Loki’s value is the label-index-only model — index what’s cheap (labels), grep what’s expensive (log content), and store compressed chunks in cheap object storage. The five stages here — labels, ingest, storage, LogQL, production — cover everything from a single Promtail tailing one log file to a multi-tenant, S3-backed, HA-paired, cached, retention-managed, log-alerting production cluster. The two habits that pay off: never use high-cardinality labels (same OOM as Prometheus), and always narrow with a label selector before line-filtering (grep all streams = full scan). Run the Loki Docker stack, tail your app logs with Promtail, query Enjoyed this post? Never miss out on future posts by following us {app="myapp"} |= "error" in Grafana, and watch the filtered logs appear — once you’ve seen LogQL narrow by label then grep by content, the model clicks.