Learn Observability in a Single Post: Complete Tutorial From Metrics, Logs, and Traces to OpenTelemetry and SLO Alerting
Observability is the ability to ask questions of your system from the outside, without shipping new code to answer them. Monitoring tells you a thing is wrong; observability lets you find out why, fast — across metrics, logs, and traces, correlated by a shared trace ID and labels. It’s the difference between “the site is slow” and “the /checkout path is 3x slower because the payments DB is doing full-table scans.” This single post teaches the whole subject in five stages, with hand-drawn diagrams and runnable snippets.
Learning Roadmap
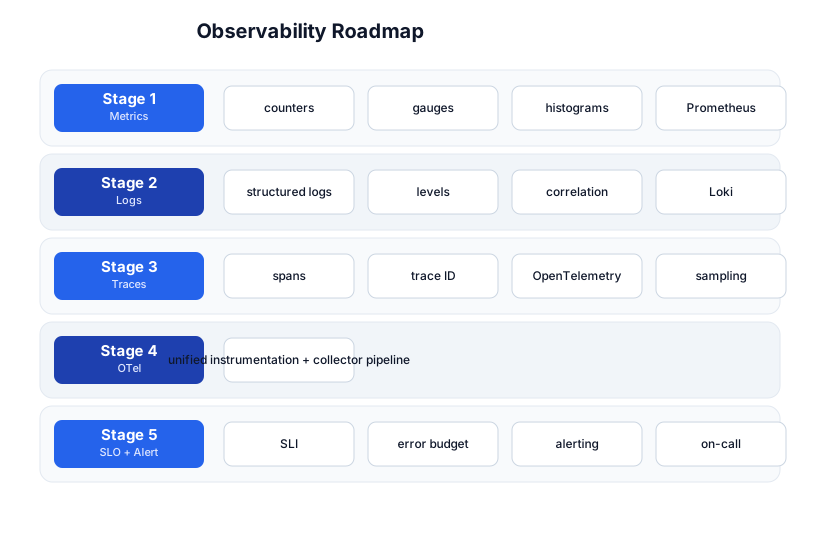
The roadmap moves from metrics (Stage 1), through logs (Stage 2) and traces (Stage 3), to the unified OpenTelemetry pipeline (Stage 4), and the SLO + alerting discipline that makes it actionable (Stage 5).
Stage 1 — Metrics
The three pillars
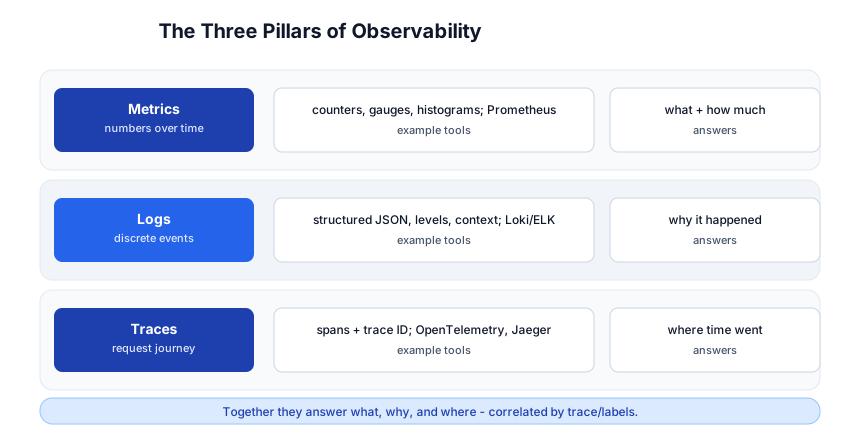
Observability rests on three pillars: metrics (numbers over time — what + how much), logs (discrete events — why), and traces (a request’s journey — where time went). Together, correlated by labels and trace IDs, they let you answer any question.
Metric types
| Type | What it is | Example |
|---|---|---|
| Counter | monotonically increasing | http_requests_total (request count) |
| Gauge | a value that goes up and down | memory_bytes, queue_depth, active_connections |
| Histogram | distribution of values in buckets | request latency, with quantile estimation |
| Summary | pre-computed quantiles (legacy) | use histograms instead in most cases |
# Prometheus client (Python)
from prometheus_client import Counter, Histogram, start_http_server

REQUESTS = Counter('http_requests_total', 'Total requests', ['route', 'method'])
LATENCY  = Histogram('http_request_duration_seconds', 'Latency', ['route'])

@LATENCY.time()
def handle(route):
    REQUESTS.labels(route=route, method='GET').inc()
    ...
Prometheus — the pull model
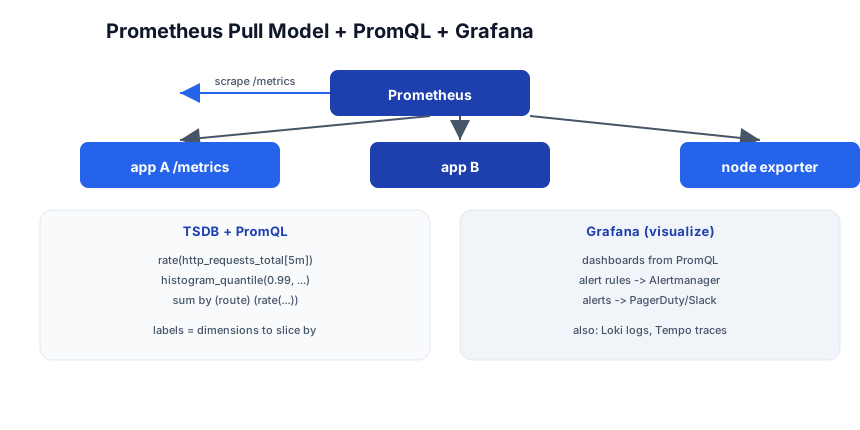
Prometheus scrapes your apps: each app exposes a /metrics endpoint, and Prometheus pulls from it on a schedule (15s by default). This pull model means no agent in your app pushing data — the app is dumb, Prometheus is smart.
# prometheus.yml
scrape_configs:
  - job_name: 'my-app'
    static_configs: [{ targets: ['app:8000'] }]
  - job_name: 'kubernetes-pods'
    kubernetes_sd_configs: [{ role: pod }]   # auto-discover K8s pods
PromQL — query the time series
# requests/sec over the last 5 minutes
rate(http_requests_total[5m])

# p99 latency
histogram_quantile(0.99, rate(http_request_duration_seconds_bucket[5m]))

# error rate
sum(rate(http_requests_total{status=~"5.."}[5m])) / sum(rate(http_requests_total[5m]))

# per-route
sum by (route) (rate(http_requests_total[5m]))
Labels are dimensions. Every metric carries labels (route, method, status, env); PromQL groups and filters by them. Design labels deliberately — they’re how you slice the data.
Pitfall: High-cardinality labels (a label per user ID, request ID, or email) blow up the time-series database — millions of series, Prometheus OOMs. Labels should have a small, bounded set of values. Put unique IDs in logs/traces, not metric labels.
Stage 2 — Logs
Structured logs
A log entry should be structured (machine-parseable JSON with fields), not free text:
{"ts":"2026-07-14T12:00:01Z","level":"error","msg":"payment failed",
 "trace_id":"abc123","user_id":"u42","order_id":"o99","amount":49.99,"error":"card_declined"}
Fields (user_id, order_id, trace_id) let you filter and correlate — “show me all logs for trace abc123” or “all payments for user u42.” Free text "payment failed for user 42" is a string-search nightmare.
Levels
debug → info → warn → error → fatal. In production, ship info and above; debug is for development. Don’t log at error what’s expected (a 404, a retry) — it drowns real errors in noise and trains people to ignore the page.
Log aggregation
- Loki — like Prometheus for logs: indexes labels (not full text), cheap, integrates with Grafana.
- ELK (Elasticsearch + Logstash + Kibana) — full-text indexing, powerful search, heavier.
- Cloud: Cloud Logging (GCP), CloudWatch Logs (AWS).
Pitfall: Logging sensitive data (PII, passwords, tokens) is a security incident. Scrub secrets before logging; structure logs so a scrubber can find fields by name.
Stage 3 — Traces
What a trace is
A trace is the end-to-end journey of one request through your system. It’s a tree of spans: each span is a unit of work (an HTTP call, a DB query, a function), with a start, duration, and attributes. Spans carry a trace ID (shared across the whole request) and a span ID (unique per span), and a parent span ID — the tree structure.
trace abc123 (HTTP GET /checkout)  ─── 220ms total
├── span: validate cart            ─── 5ms
├── span: POST /payments            ─── 180ms   ← the slow one
│   └── span: DB INSERT charge       ─── 175ms  ← the real cause
└── span: render receipt            ─── 3ms
A trace shows you where time went and the call graph — the single best tool for “why is this slow?”
Distributed tracing
In a microservice system, a trace spans services: service A calls B calls C. Each service contributes spans to the same trace (via propagated headers: traceparent). OpenTelemetry (Stage 4) is how spans get created and propagated; Jaeger, Tempo, or Zipkin store and visualize them.
Sampling
You can’t trace 100% of traffic at scale (too much data). Sampling traces a fraction:
- Head-based — the first service decides (random %), same decision for the whole trace. Simple, but misses rare errors.
- Tail-based — sample after the trace completes (e.g. keep all errors, 1% of successes). Smarter, more expensive.
Pitfall: If sampling is inconsistent across services, a trace breaks mid-journey. Use a consistent sampling decision (head-based, propagated) so the whole trace is kept or dropped together.
Stage 4 — OpenTelemetry
The problem OTel solves
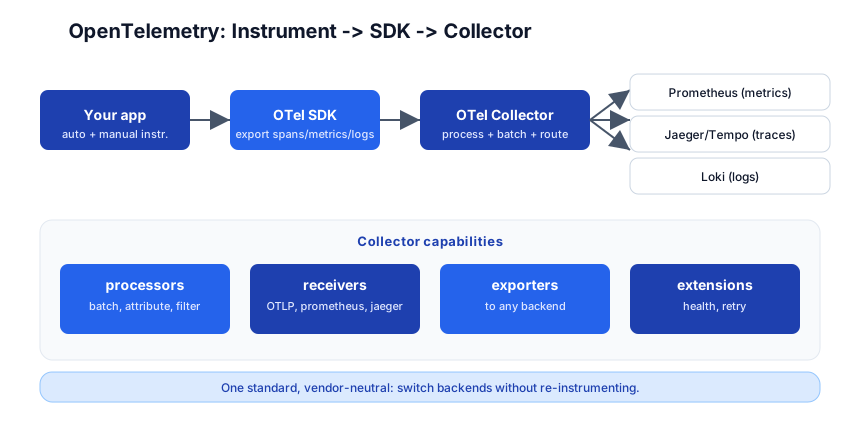
Before OpenTelemetry, every vendor (Datadog, New Relic, Jaeger, Honeycomb) had its own instrumentation library. Switching backends meant re-instrumenting your whole codebase. OpenTelemetry (OTel) is the vendor-neutral standard: instrument once, export to any backend.
The pipeline
- Instrumentation — auto (library integrations that create spans/metrics for HTTP, DB, etc.) + manual (custom spans, attributes).
- SDK — configures the instrumentation, batches, and exports.
- Collector — a standalone process that receives OTLP, processes (batch, filter, add attributes), and exports to backends (Prometheus, Jaeger, Loki, Datadog, any).
# Python: OTel SDK setup
from opentelemetry import trace
from opentelemetry.sdk.trace import TracerProvider
from opentelemetry.sdk.trace.export import BatchSpanProcessor, OTLPSpanExporter

trace.set_tracer_provider(TracerProvider())
trace.get_tracer_provider().add_span_processor(
    BatchSpanProcessor(OTLPSpanExporter(endpoint="otel-collector:4317"))
)

# manual span
tracer = trace.get_tracer(__name__)
with tracer.start_as_current_span("process_payment") as span:
    span.set_attribute("order_id", order_id)
    charge(order_id)
The Collector
The OTel Collector is the heart of a production pipeline: it decouples your apps from the backends. Apps export OTLP to the collector; the collector fans out to Prometheus (metrics), Jaeger/Tempo (traces), Loki (logs) — or to a SaaS vendor. Change backends by reconfiguring the collector, not your apps.
# otel-collector config (simplified)
receivers:   { otlp: { protocols: { grpc: { endpoint: 0.0.0.0:4317 } } } }
processors: { batch: {}, resource: { attributes: [{ key: env, value: prod }] } }
exporters:
  prometheus: { endpoint: 0.0.0.0:8889 }   # metrics -> Prometheus scrapes
  otlp/tempo: { endpoint: tempo:4317 }       # traces -> Tempo
  loki: { endpoint: loki:3100 }             # logs -> Loki
service: { pipelines: { ... } }
Pitfall: Don’t point every app directly at every backend. Run a collector (or a gateway collector in front of it). It batches, retries, drops on overload, and lets you swap backends without touching apps.
Stage 5 — SLOs + Alerting
SLI, SLO, error budget
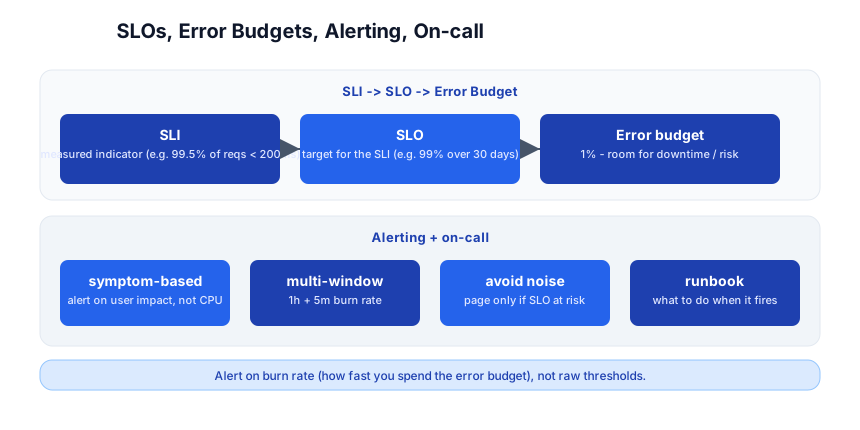
- SLI (service-level indicator) — a measured metric: “99.5% of
/checkoutrequests complete in < 200ms.” - SLO (service-level objective) — the target for the SLI over a window: “99% over 30 days.”
- Error budget — the 1% gap (100% − 99%) = how much unreliability you can “afford.” It’s the room for deploys, experiments, and risk.
The error budget reframes reliability as a product decision: if you’re burning it slowly, you can ship faster; if you’re burning it fast, you freeze feature work and fix reliability.
Burn-rate alerting
Don’t alert on “CPU > 80%” — that’s a cause you guessed, and it may not matter. Alert on symptoms (user impact) via burn rate: how fast you’re spending the error budget.
# page if spending budget 14x faster than allowed over 1h AND 5m
# (multi-window multi-burn-rate — the SRE standard)
job:slo_errors:ratio_rate5m > 14 * (1 - 0.99)
and job:slo_errors:ratio_rate1h > 14 * (1 - 0.99)
Multi-window burn-rate alerts fire only when the budget is genuinely at risk over both a short and long window — far fewer false pages than raw-threshold alerts.
On-call + runbooks
An alert that pages a human must:
- Be actionable (the human can do something about it).
- Have a runbook (the steps to diagnose and fix).
- Auto-recover if possible (the alert should also fire when it self-resolves).
Pitfall: Alert fatigue is how on-call dies. If a page fires and the right response is “ignore it,” you’ve trained the team to ignore all pages — including the real one. Every noisy alert is a bug; fix it or delete it.
Quick-Start Checklist
- Expose a
/metricsendpoint (Prometheus format) with a counter + histogram. - Run Prometheus to scrape it; open the Prometheus UI and run a
rate()query. - Add Grafana, point it at Prometheus, build a dashboard.
- Emit structured JSON logs with a
trace_idfield; aggregate in Loki. - Add OpenTelemetry — auto-instrumentation for your framework; export to a collector.
- Run the OTel Collector fanning out to Prometheus (metrics) + Tempo/Jaeger (traces).
- Define one SLI + SLO (e.g. 99% of
/apirequests < 200ms over 30d). - Set a burn-rate alert on that SLO, paging to a channel.
- Write a runbook for the alert; test it by triggering the condition.
- Review alerts monthly — delete or fix every noisy one.
Common Pitfalls
- High-cardinality metric labels (user ID, request ID) — explodes the TSDB; put those in logs/traces.
- Free-text logs — unsearchable; emit structured JSON with fields.
- Logging secrets/PII — a security incident; scrub before logging.
- Cause-based alerts (“CPU high”) — alert on symptoms (user impact) instead.
- Alert fatigue — every non-actionable page erodes trust; delete noisy alerts.
- No runbook — a page with no instructions wastes on-call time; write the steps.
- Inconsistent sampling — breaks distributed traces; propagate one decision.
- Every app -> every backend — use a collector so swapping backends is config, not code.
errorlevel for expected events — drowns real errors; log those atinfo/warn.
Further Reading
- OpenTelemetry Docs — the standard
- Prometheus Docs — metrics + PromQL
- Grafana Docs — dashboards + alerting
- Google SRE Book — SLOs, error budgets, alerting (free)
- Observability Engineering by Charity Majors et al — the modern reference
Related guides
Observability is the ops layer that watches the rest of the stack — these PyShine tutorials connect to it:
- Learn Kubernetes in One Post — Prometheus + Grafana are the K8s monitoring default; the kube-prometheus-stack Helm chart sets it up.
- Learn Docker in One Post — containerize Prometheus, Grafana, and the OTel collector with Compose.
- Learn GitHub Actions in One Post — alert on-call from CI when a deploy breaks an SLO.
- Learn System Design in One Post — SLOs and error budgets are system-design concepts applied to production.
- Learn Python in One Post / Learn Node.js in One Post — instrument these backends with OTel.
Observability is what separates a system you operate from one that surprises you. The five stages here — metrics, logs, traces, OpenTelemetry, SLOs + alerting — cover everything from a single counter to a vendor-neutral, SLO-driven, burn-rate-alerted production setup. The two habits that pay off forever: emit structured logs with a trace ID (so you can always follow a request), and alert on symptoms via burn rate, not on guessed causes (so the page always means something). Expose one Enjoyed this post? Never miss out on future posts by following us /metrics endpoint, scrape it with Prometheus, draw one dashboard in Grafana — once you’ve watched a request’s latency show up in a graph, the rest follows.