Learn Prometheus in a Single Post: Complete Tutorial From Metrics and the Pull Model to PromQL, Alerting, and Grafana
Prometheus is the metrics half of the observability stack — a time-series database that scrapes metrics from your services, stores them, and lets you query them with PromQL to build dashboards and alerts. It’s the de-facto standard for cloud-native monitoring (born at SoundCloud, graduated by the CNCF, used by every Kubernetes cluster). This single post covers the whole system in five stages, with hand-drawn diagrams and runnable config.
Learning Roadmap
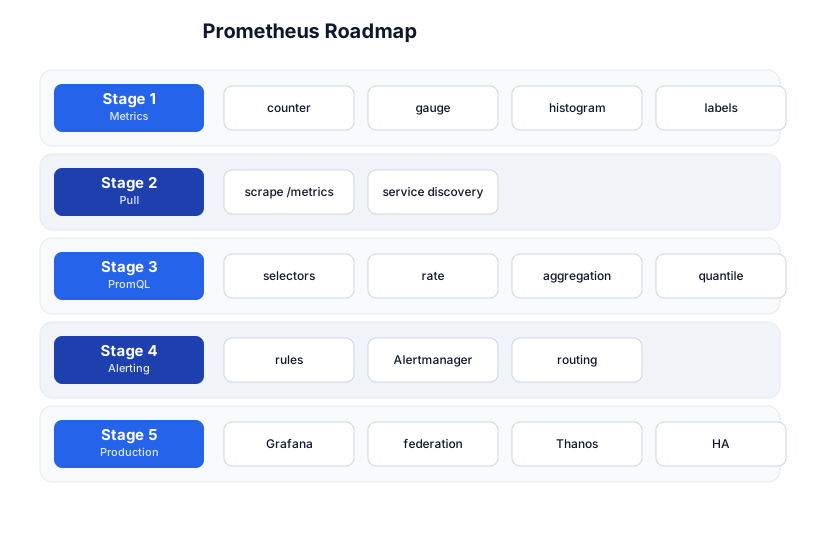
The roadmap moves from metric types (Stage 1), through the pull model (Stage 2), PromQL (Stage 3), alerting (Stage 4), and production (Stage 5). The Observability tutorial is the prerequisite — this post goes deep on the metrics pillar specifically.
Stage 1 — Metric Types
The four metric types
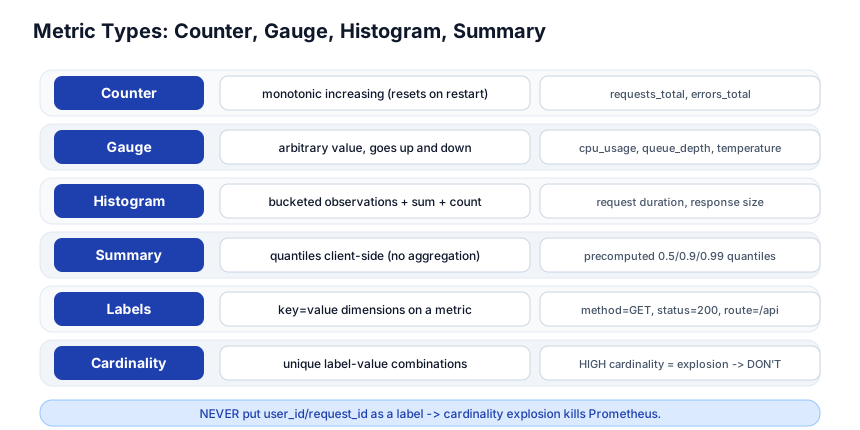
| Type | Behavior | Example |
|---|---|---|
| Counter | monotonic increasing (resets only on restart) | http_requests_total, errors_total |
| Gauge | arbitrary value, goes up and down | cpu_usage, queue_depth, temperature |
| Histogram | bucketed observations + sum + count | http_request_duration_seconds |
| Summary | quantiles computed client-side | precomputed p50/p90/p99 |
Counter vs Gauge — the fundamental distinction
- Counter — only goes up (or resets to 0 on restart). You always query its rate of change (
rate(http_requests_total[5m])), never the raw value (which is meaningless — “10,000 total requests” tells you nothing without a time window). - Gauge — the value itself is meaningful (
cpu_usage = 0.73is “73% right now”). Query it directly.
Histogram vs Summary — for quantiles
- Histogram — buckets observations into configurable buckets (
le="0.1",le="0.5",le="1", …). Quantiles are computed server-side withhistogram_quantile(). Buckets can be aggregated across instances. This is the recommended choice — it’s aggregatable. - Summary — computes quantiles client-side (the application calculates p50/p90/p99). Quantiles can’t be aggregated across instances (you can’t average p99s). Use only when you need exact quantiles and can’t aggregate.
Labels and cardinality
# A metric with labels (dimensions)
http_requests_total{method="GET", status="200", route="/api/users"}
Labels are key=value pairs that slice a metric into separate time series. method, status, route are good labels — low cardinality (a few dozen values each).
Pitfall: Never put high-cardinality values as labels —
user_id,request_id,session_id,
Stage 2 — The Pull Model
Prometheus scrapes targets (pull, not push)
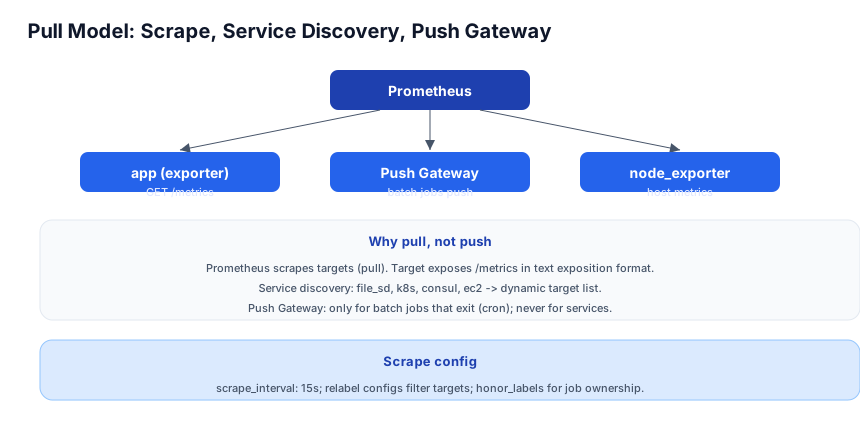
Prometheus pulls metrics from targets — each target exposes a /metrics endpoint in the text exposition format, and Prometheus scrapes it on a schedule (default every 15s):
# HELP http_requests_total Total HTTP requests
# TYPE http_requests_total counter
http_requests_total{method="GET",status="200"} 1027
http_requests_total{method="POST",status="500"} 3
# prometheus.yml
scrape_configs:
  - job_name: "myapp"
    scrape_interval: 15s
    static_configs:
      - targets: ["app1:8080", "app2:8080"]
  - job_name: "kubernetes-pods"
    kubernetes_sd_configs:
      - role: pod
    relabel_configs:
      - source_labels: [__meta_kubernetes_pod_annotation_prometheus_io_scrape]
        action: keep
        regex: true
Why pull, not push?
- Push (StatsD, Datadog Agent) — the app sends metrics to the server. Problem: if the server is down, the app buffers or drops; you don’t know which apps are being monitored.
- Pull (Prometheus) — the server asks each target. If a target is down, the scrape fails and you see it (an
up == 0series). The server controls the scrape rate. No agent needed on the target — just expose/metrics.
Service discovery
For dynamic environments (Kubernetes, cloud), the target list changes constantly. Service discovery generates the target list at runtime:
kubernetes_sd_configs— discover Kubernetes pods/services by label/annotation.ec2_sd_configs— discover AWS EC2 instances.consul_sd_configs— discover Consul-registered services.file_sd_configs— read targets from a file (updated by an external process).
Push Gateway — for batch jobs
from prometheus_client import CollectorRegistry, Counter, push_to_gateway
registry = CollectorRegistry()
jobs_done = Counter('batch_jobs_done_total', 'Batch jobs completed', registry=registry)
jobs_done.inc()
push_to_gateway('pushgateway:9091', job='nightly_etl', registry=registry)
Batch jobs (cron, ETL) exit before Prometheus can scrape them. They push their metrics to the Push Gateway, which exposes them for Prometheus to scrape. Only use the Push Gateway for batch jobs — never for long-running services (it breaks the pull model and becomes a single point of failure).
Pitfall: Don’t use the Push Gateway for services. A service should expose
/metricsand let Prometheus pull. The Push Gateway is only for jobs that start, do work, and exit — and even then, push the metrics at the end of the job, not throughout.
Stage 3 — PromQL
Instant vs range vectors
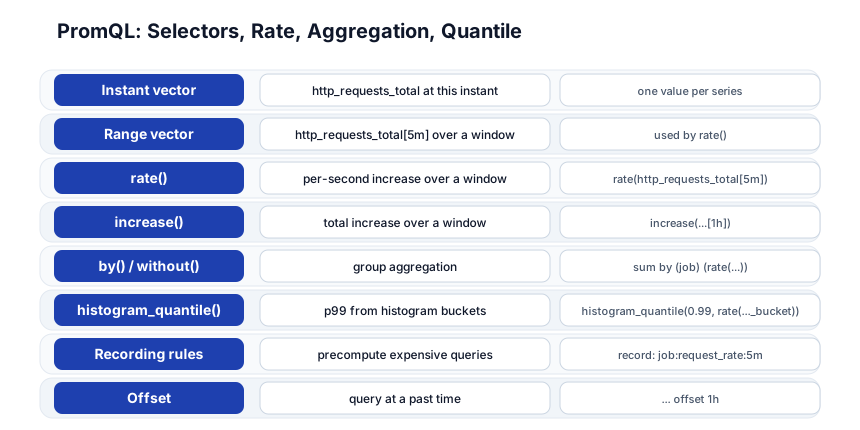
| What it returns | Example | |
|---|---|---|
| Instant vector | one value per series, at this instant | http_requests_total |
| Range vector | values over a time window | http_requests_total[5m] |
| Scalar | a single number | 5 |
rate() — the workhorse
# requests per second over the last 5 minutes
rate(http_requests_total[5m])

# total increase over the last hour
increase(http_requests_total[1h])
rate() computes the per-second rate of increase of a counter over a window. It handles counter resets (if the counter resets to 0, rate still works). Always use rate() on counters, never the raw value.
Aggregation: sum by
# total request rate, grouped by job
sum by (job) (rate(http_requests_total[5m]))

# error rate per route
sum by (route) (rate(http_requests_total{status=~"5.."}[5m]))
   / sum by (route) (rate(http_requests_total[5m]))
sum by (label) aggregates series that share a label value. without (label) aggregates everything except the listed labels. The classic pattern: sum by (job) (rate(...)) — group the per-second rate by job.
histogram_quantile() — p99 from histograms
# 99th percentile request duration over 5m
histogram_quantile(0.99, sum by (le) (rate(http_request_duration_seconds_bucket[5m])))
histogram_quantile(quantile, buckets) computes a quantile from histogram buckets. Note the sum by (le) — you must aggregate the _bucket series by the le (less-than-or-equal) label before computing the quantile.
Recording rules — precompute expensive queries
# rules.yml
groups:
  - name: precomputed
    rules:
      - record: job:request_rate:5m
        expr: sum by (job) (rate(http_requests_total[5m]))
A recording rule precomputes a frequently-used, expensive query and stores the result as a new time series. Dashboards and alerts then query the precomputed series (job:request_rate:5m) instead of re-running the expensive query on every render. This is the #1 Prometheus performance optimization.
Pitfall: A dashboard querying
rate(http_requests_total[5m])across 1000 series on every refresh is expensive. Precompute it as a recording rule (job:request_rate:5m) and query that — 1000 series becomes 10 (one per job), and the query is instant.
Stage 4 — Alerting
Alerting rules
# alerts.yml
groups:
  - name: app-alerts
    rules:
      - alert: HighErrorRate
        expr: |
          sum by (job) (rate(http_requests_total{status=~"5.."}[5m]))
            / sum by (job) (rate(http_requests_total[5m])) > 0.05
        for: 10m              # must be true for 10 minutes
        labels:
          severity: page      # routes to on-call
        annotations:
          summary: "High error rate on "
          description: " of requests are 5xx"
expr— the PromQL condition that triggers the alert.for— how long the condition must hold before firing (prevents flapping).labels— metadata used for routing (severity: page→ PagerDuty;severity: warn→ Slack).annotations— the human-readable message (templated with$labelsand$value).
Alertmanager — routing, dedupe, silence
Prometheus fires alerts to Alertmanager, which handles the delivery:
- Routing — send
severity=pageto PagerDuty,severity=warnto Slack,severity=infoto email. - Deduplication — if 100 instances all alert “HighErrorRate,” Alertmanager sends one notification, not 100.
- Grouping — group alerts by
alertname+clusterso they arrive as one message. - Silencing — mute an alert during a maintenance window or a known incident.
- Inhibition — if
ClusterDownfires, suppressNodeDownalerts for that cluster (the root cause subsumes the symptoms).
# alertmanager.yml
route:
  receiver: default
  group_by: ["alertname", "cluster"]
  group_wait: 30s
  group_interval: 5m
  repeat_interval: 4h
  routes:
    - matchers: ['severity="page"']
      receiver: pagerduty
    - matchers: ['severity="warn"']
      receiver: slack
receivers:
  - name: pagerduty
    pagerduty_configs:
      - service_key: "..."
  - name: slack
    slack_configs:
      - api_url: "..."
Pitfall: An alert without
for:fires the instant the condition is true — and flaps on/off every scrape. Always addfor: 5m(or appropriate) so transient spikes don’t page on-call at 3am.
Stage 5 — Production
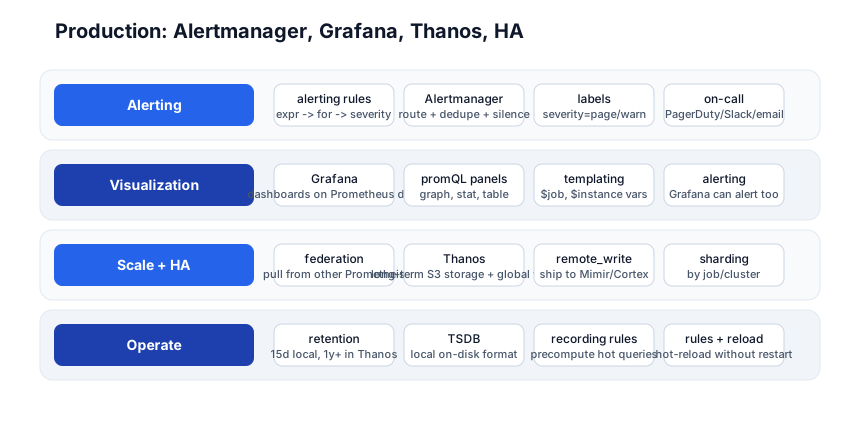
Grafana — dashboards
Grafana is the visualization layer — it queries Prometheus with PromQL and renders dashboards (graphs, stats, tables, heatmaps). Features: templating ($job, $instance dropdowns), alerting (Grafana can alert too, though Alertmanager is the standard), and shared community dashboards.
Federation — pull from other Prometheis
# a global Prometheus federates from per-cluster Prometheis
scrape_configs:
  - job_name: "federate"
    honor_labels: true
    metrics_path: "/federate"
    params:
      "match[]": ['{job="myapp"}']
    static_configs:
      - targets: ["prometheus-cluster1:9090", "prometheus-cluster2:9090"]
Federation lets one Prometheus scrape selected series from others — a global view over per-cluster Prometheus instances. Use for hierarchical aggregation (cluster Prometheus → global Prometheus).
Thanos / Mimir / Cortex — long-term storage + global view
Prometheus stores data locally for ~15 days (it’s not designed for long-term retention). For long-term storage and a global query view across multiple Prometheis:
- Thanos — ships Prometheus data to object storage (S3/GCS), provides a global query layer (Thanos Query), and deduplicates across HA pairs. The most popular option.
- Mimir / Cortex — horizontally-scalable, multi-tenant long-term storage (Grafana Labs).
remote_writefrom Prometheus to Mimir.
# prometheus.yml — ship metrics to long-term storage
remote_write:
  - url: "http://mimir:9009/api/v1/push"
High availability
Prometheus itself is not HA by default — run two identical Prometheus instances (each scraping all targets) and deduplicate with Thanos or alert on both (Alertmanager dedupes the alerts). Don’t put Prometheus behind a load balancer (each instance must scrape everything; they’re not sharded stateless services).
Retention
# prometheus.yml
storage.tsdb.retention.time: 15d        # local retention
storage.tsdb.retention.size: 100GB      # or by size
Keep local retention short (15d) for fast queries; ship to Thanos/Mimir for 1+ year retention. Long local retention makes restarts slow and queries over old data expensive.
Quick-Start Checklist
- Run Prometheus —
docker run -p 9090:9090 prom/prometheus. - Open the UI at
http://localhost:9090— queryupto see targets. - Instrument an app —
prometheus_client(Python),prom-client(Node),prometheus(Go); expose/metrics. - Add a scrape config —
job_name: myapp,targets: ["app:8080"]. - Query with PromQL —
rate(http_requests_total[5m]),sum by (job) (...). - Add a histogram for request duration; query
histogram_quantile(0.99, ...). - Write a recording rule — precompute a hot query.
- Write an alerting rule —
expr + for: 5m + labels.severity. - Run Alertmanager — route
pageto PagerDuty,warnto Slack. - Connect Grafana — add Prometheus as a datasource, build a dashboard.
Common Pitfalls
- High-cardinality labels —
user_id/request_idas labels → cardinality explosion → OOM. Never. - Querying raw counter values — meaningless; always
rate()orincrease(). - No
for:on alerts — flaps on every scrape; addfor: 5m. - Push Gateway for services — only for batch jobs; services expose
/metricsfor pull. - No recording rules — expensive queries re-run on every dashboard refresh; precompute.
- Long local retention — slow restarts, expensive queries; ship to Thanos/Mimir for long-term.
- Prometheus behind a load balancer — wrong; each instance scrapes everything, dedupe with Thanos.
- Summary for aggregatable quantiles — Summary quantiles can’t be aggregated across instances; use Histogram.
Further Reading
- Prometheus Docs — the official reference
- PromQL Cheatsheet — the query functions
- Prometheus: Up & Running by Brian Brazil — the canonical book
- Thanos Docs — long-term storage
- Awesome Prometheus Alerts — alerting rule collection
Related guides
Prometheus is the metrics pillar of observability — these PyShine tutorials connect to it:
- Learn Observability in One Post — the umbrella; metrics + logs + traces. Prometheus is the metrics half.
- Learn Kubernetes in One Post — the Prometheus Operator runs Prometheus as a K8s resource; service discovery is built in.
- Learn Docker in One Post — run Prometheus + Grafana + Alertmanager in containers.
- Learn Python in One Post —
prometheus_clientis the Python instrumentation library. - Learn Ansible in One Post — deploy Prometheus to a fleet of hosts with a playbook.
Prometheus’s value is the pull model + PromQL + a metric-type system that forces good instrumentation — you scrape targets (so you know what’s being monitored), you query with a purpose-built language (not SQL on a generic DB), and the counter/gauge/histogram types make you think about what each metric means. The five stages here — metrics, pull, PromQL, alerting, production — cover everything from a single Enjoyed this post? Never miss out on future posts by following us /metrics endpoint to a federated, Thanos-backed, Alertmanager-routed, Grafana-visualized production monitoring system. The two habits that pay off: never use high-cardinality labels (it OOMs Prometheus), and always rate() counters + for: on alerts (raw counter values are meaningless; un-for‘d alerts flap). Instrument an app with prometheus_client, expose /metrics, query rate(http_requests_total[5m]) in the Prometheus UI, and watch the per-second rate appear — once you’ve seen PromQL return a rate, the model clicks. 


